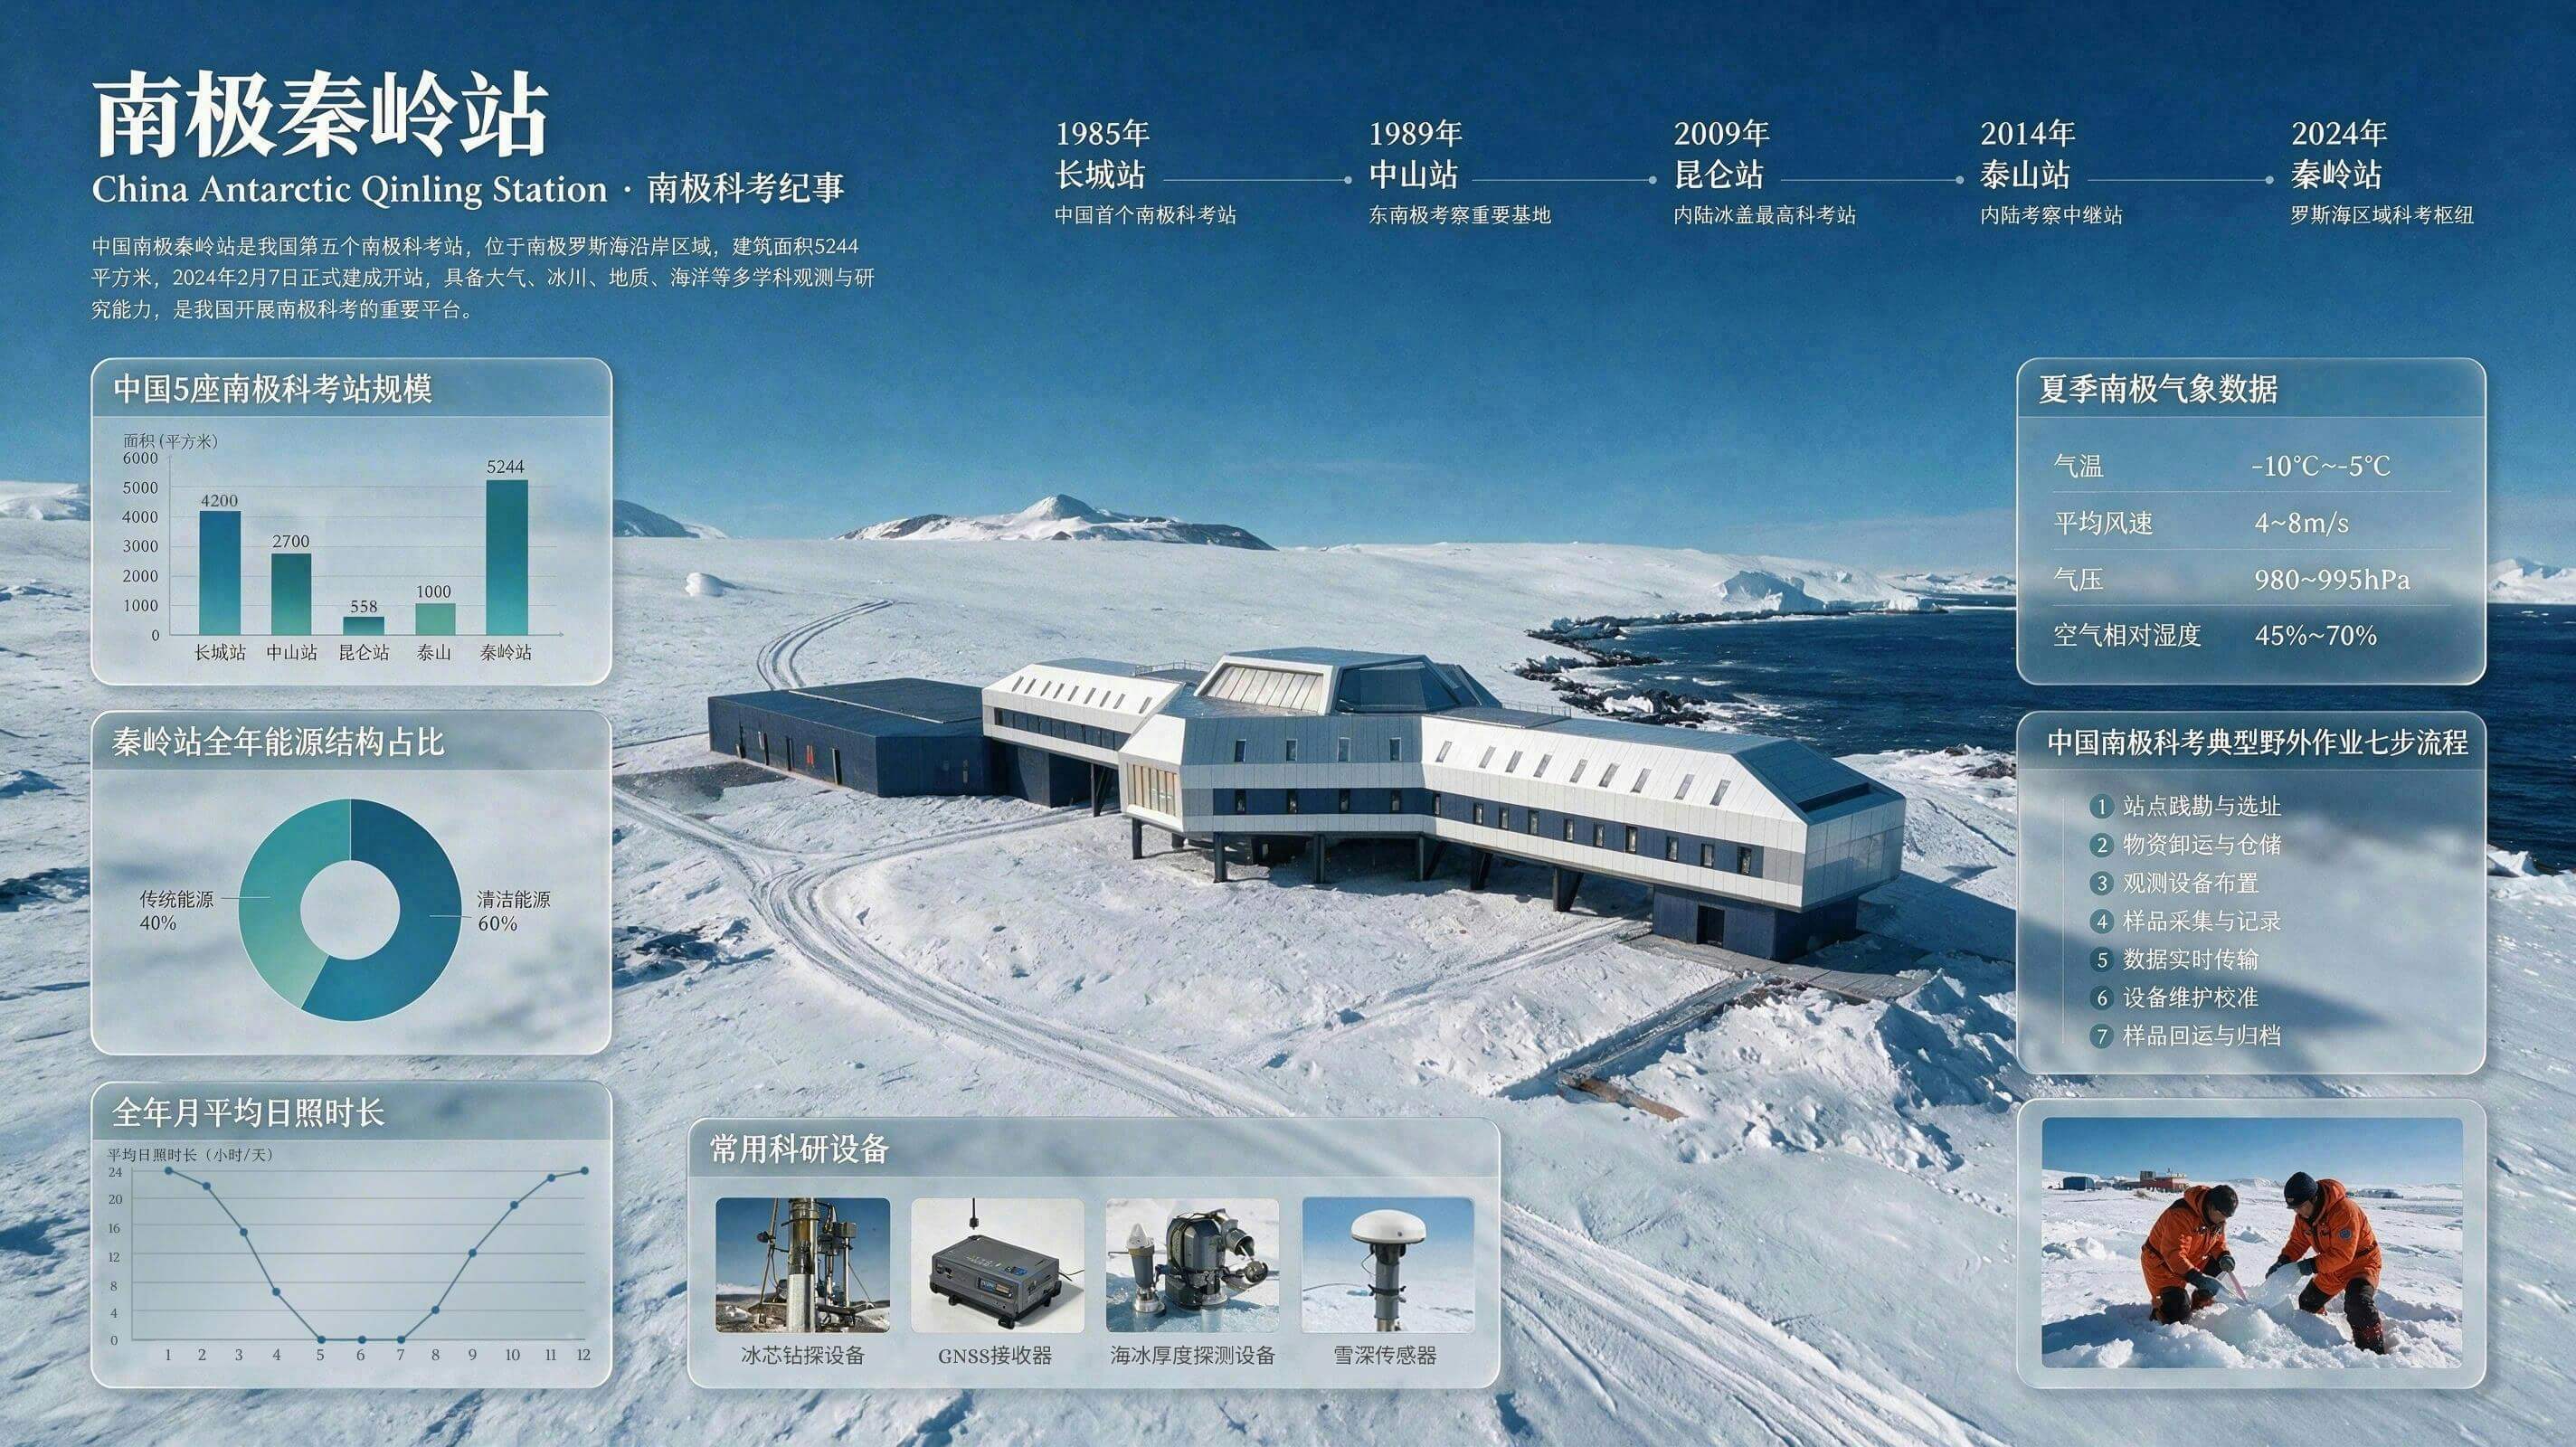
南極・秦嶺基地の研究を総合的に示すインフォグラフィック
 Seedream 5ByteDanceimage
南極・秦嶺基地における科学研究を記録したビジュアルインフォグラフィック。中央に秦嶺基地のメイン建物を配置。その周囲に、基地開発のタイムライン、5つの基地の規模比較を示す棒グラフ、基地のエネルギー源を示す円グラフ、月ごとの日照時間の折れ線グラフを配置。さらに、研究機材のリアルな写真、夏季の天候パネル、7段階のフィールドワークのフローチャート、現地でのサンプリング撮影を加え、中国の南極研究を包括的に紹介する。
詳細情報
- タイプ
- AI 画像プロンプト
- アスペクト比
- 89:50
- 更新日
- 2026/07/08
このプロンプトの使い方
- 1上のコピーボタンでプロンプト全文をコピーします。
- 2ByteDance の Seedream 5、または近いスタイルに対応した画像生成ツールを開きます。
- 3プロンプトを貼り付け、被写体やスタイルのキーワードを自分のイメージに置き換えます。
- 4作例の設定(89:50 · Cyberpunk · Architecture · Cityscape)に合わせて生成し、少しずつ調整を重ねます——わずかな言い回しの違いで結果が大きく変わります。
よくある質問
この画像はどの AI モデルで生成されましたか?
この画像は ByteDance の Seedream 5 で生成されました。ページ上のプロンプトが、生成に使われた原文そのものです。
このプロンプトはどんな設定を使っていますか?
作例は Seedream 5 で、次の設定で生成されました:89:50 · Cyberpunk · Architecture · Cityscape。同じ設定を使うと最も近い結果が得られます。
似た結果を得るにはどうすればいいですか?
まずプロンプトをそのままコピーし、スタイル・ライティング・構図のキーワードは残して被写体だけ置き換えます。出力は毎回変わるので、数回生成して選びましょう。
このプロンプトを改変してもいいですか?
もちろんです。プロンプトは出発点として使うのが最適——記述語やアスペクト比、スタイルタグを調整して、自分だけの作品に仕上げてください。